Most shared services organizations have taken initial steps to explore robotic process automation (RPA) and other digital automation tools for various functions in finance, procurement, customer service and human resources. Emerging technologies promise to drive better productivity and efficiencies for many back-office functions, and shared services organizations are smart to take advantage of these benefits. But the organizations that will make the most of these initiatives will be the ones that first develop a framework to measure the specific efficiency and productivity gains for which they are hoping.
To measure the success of a digital initiative, an organization must baseline its internal processes at the beginning of the digital journey. Measures to consider are two dimensional: 1) improvement in volume productivity and 2) improvement in cost productivity across the business functions being digitized.
Let’s look at accounts payable as an example. The following baselines are required before the start of the digital initiative:
- Volume productivity - total number of invoices processed per full-time equivalent (FTE) per month
- Cost productivity - cost to process per invoice
The availability of cost data can impede some organizations. Ideally, the cost data should include all expenses related to people, facilities, overhead, IT and systems. However, many organizations may not have detailed cost allocations per finance function, in which case they should develop a baseline with people costs (including salary and benefits) associated with the AP function.
The table below shows the recommended volume and cost measures for various back-office functions.
|
Function |
Volume Measure |
Cost Measure |
|
Accounts Payable (AP) |
# invoices processed per FTE per month |
Cost to process each invoice |
|
Accounts Receivables (AR) |
# cash reconciliations per FTE per month |
Cost per cash reconciliation |
|
General Ledger (GL) |
# journal entry line items per FTE |
Cost per GL line |
|
Procurement |
# purchase orders per FTE |
Cost per purchase order |
|
Payroll |
# employee payroll handled per FTE |
Cost per employee paid |
|
Customer Call Center |
# calls/minutes handled per FTE |
Cost per call |
Once an organization has established the above baselines, it must commit to an annual regimen to determine the actual impact to the productivity metrics. Organizations should create a framework to define the variables that impact productivity in their environment, so they build a consistent year-on-year measurement.
Improvements in volume and cost productivity across an organization will vary based on the maturity of its RPA implementations, ERP system, use of bolt-on tools and use of cloud-based technologies, among other things.
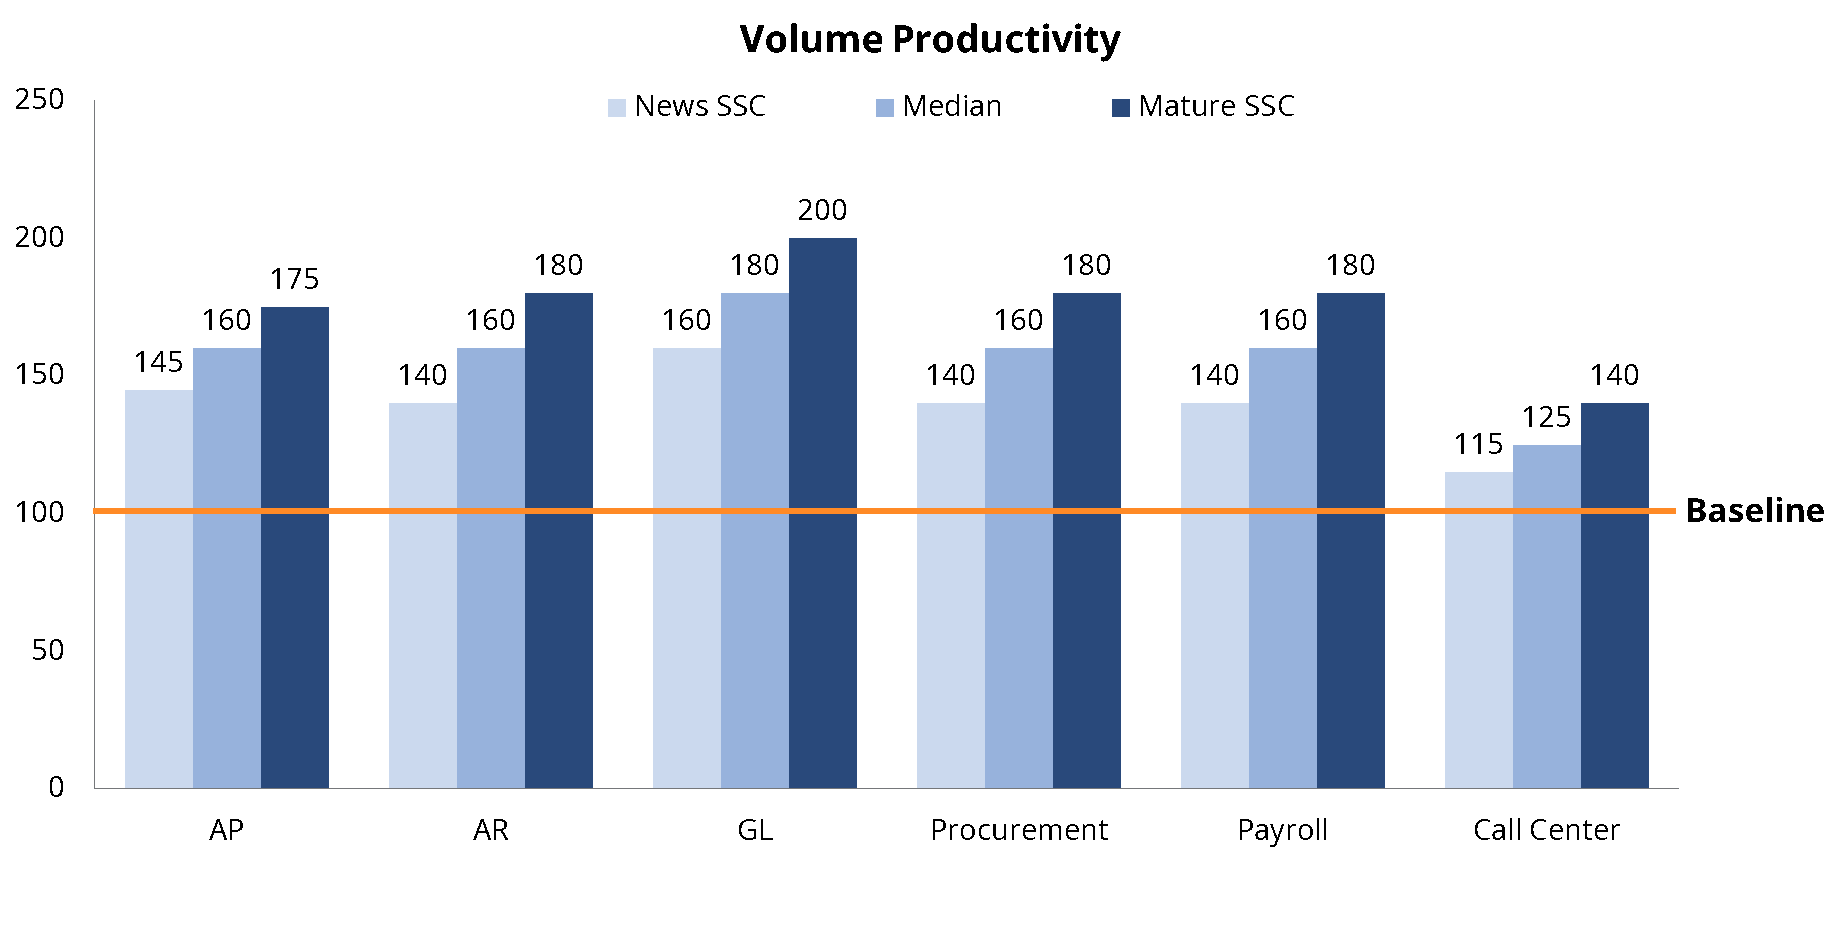
The graph below shows the range of volume productivity shared services centers can achieve depending on the maturity of their operations. Each of the functions listed in the chart above is represented along the x axis. The baseline for productivity in this case is set to 100 at the outset of the digital initiatives. The light blue bars represent productivity volume for new shared services centers, and dark blue bars indicate productivity volume for mature shared services centers.

The delta between productivity measures for new shared services center and mature ones indicate productivity improvements that provide an attractive return on investment for the digital initiatives.
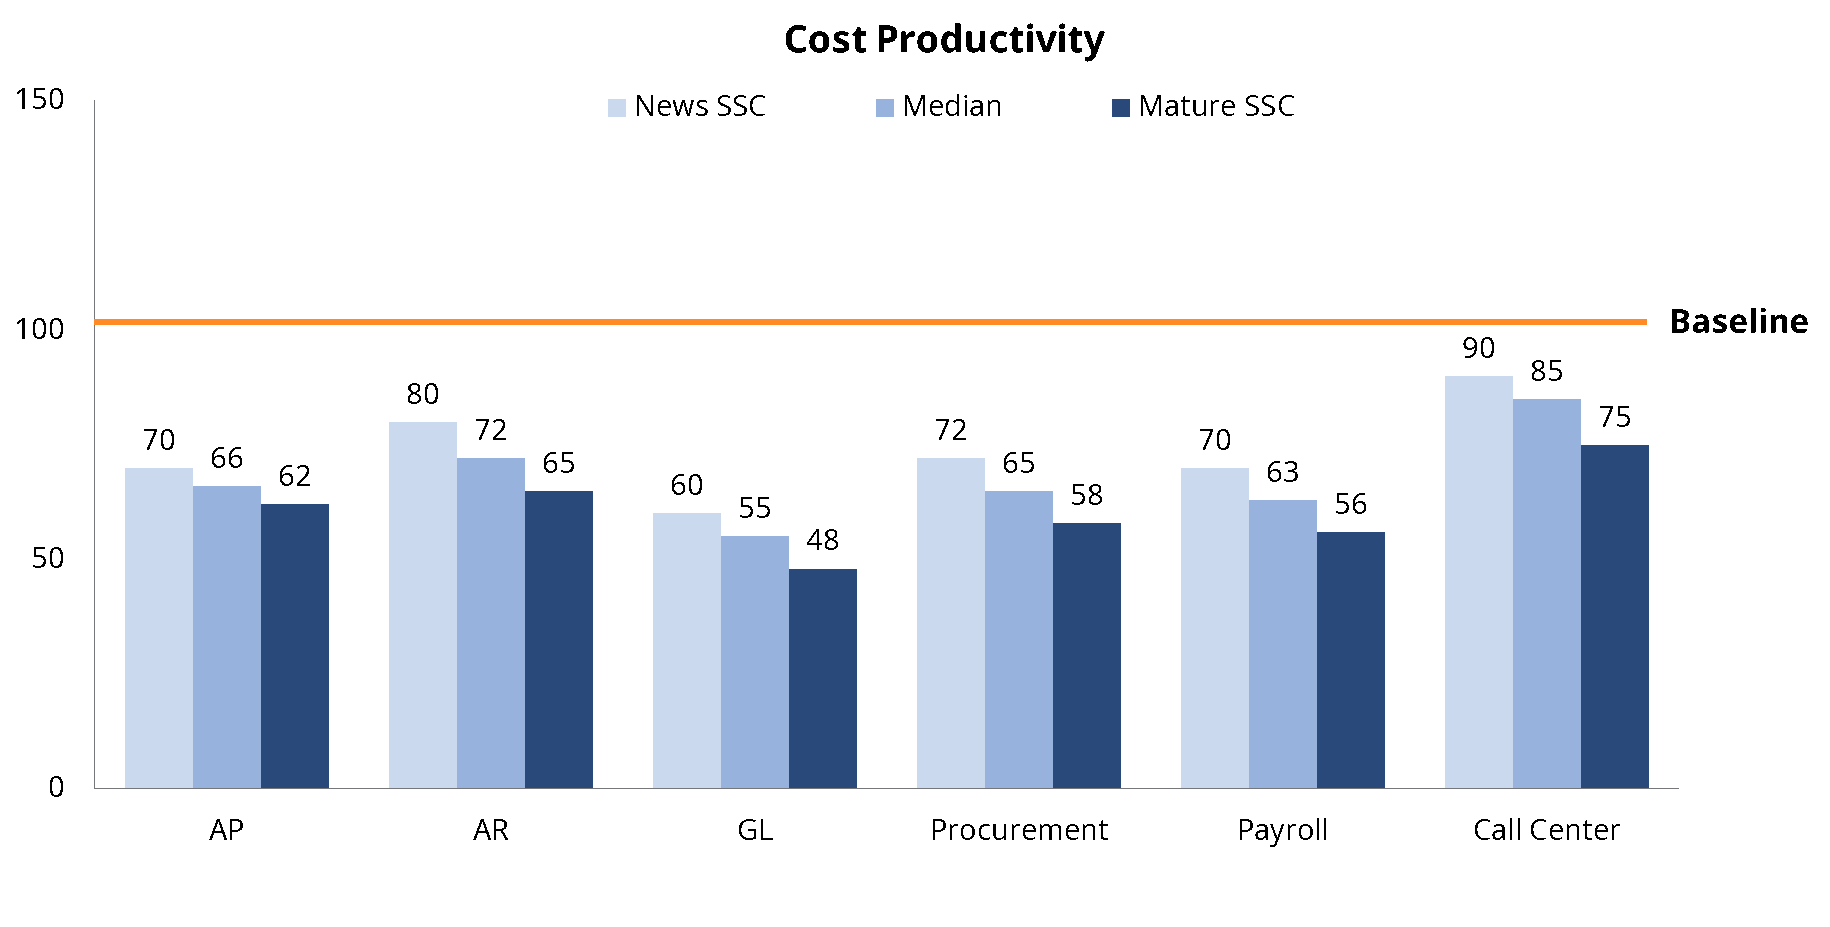
The chart below demonstrates the transaction price improvements organizations can expect to achieve over a three-year period. For example, if the cost to process each invoice for accounts payable is 100 at the beginning of the digital journey, it should reduce by 30-38 percent depending on the maturity of the shared service organization.

Digital initiatives can drive significant benefits in back-office functions of shared services organizations. Recent ISG benchmarks of shared service centers that have implemented RPA on a large-scale show these organizations outpacing what was previously deemed “best in class.” In fact, the industry best-in-class numbers of a year ago are now outdated due to the efficiencies driven by RPA and other digital technologies. RPA and artificial intelligence (AI) are quickly leveling the playing field for best in class. While the largest shared service centers once were able to drive a lower cost per transaction due to economies of scale, shared service centers with true RPA/AI centers of excellence have built scale in the automation team to even out the playing field, leading to the transformational impacts on productivity and costs referred to earlier.
ISG has a comprehensive framework and benchmark data for shared service organizations interested in measuring performance along their digital journey. Contact us to discuss how we can help.
This article originally appeared in the SSON Guide to Shared Services Centers.
About the author
Gautam Saha is a Business Transformation and Management Leader with global experience in IT and BPO industry.
